Throughput (forecasting) vs Story Points (estimation) for planning work / capacity
Myth and reality
It may sound just a nuance, and definitely the concepts are related, but there’s a technical difference forecasting and estimation. Forecasting is about predicting future events or trends based on historical data and analysis. Estimation is about determining the value, size or quantity of something that is currently unknown or uncertain.
I believe that in software development, many people get to carry on with that very last statement: currently unknown or uncertain. And because of that tend to think that estimation is a better way to approach planning than an alternative which would rely upon previous historical data trends.
I must confess I find that interesting – not necessarily in a good sense – because I don’t believe it takes that much to prove how that as a case of myth and reality getting sort of switched around.
Myth: software development is always so unique that any piece of work tends to be unknown and uncertain upfront, therefore our only chance is to try to estimate based on expert knowledge.
Reality: most of software development is not so unknown, it’s often close enough to other things we have done before, and more importantly: good teams over time can get quite good at slicing work in ways that work will normally flow with enough regularity (thus probabilistically predictable).
And even if it is the case that a team is either not so good just yet in ensuring regular flow of work, or that there are inherent uncertainties, all it takes to make good use of forecasting based on historical data is to understand that we need to think of it probabilistically. Not as a single indicator projecting what is the plan, but rather as patterns and ranges of possible scenarios informed by statistically sound approach.
Allow me to work through two angles in confronting the difference between going with one (throughput-based forecasting) or the other (estimation-based projection)…
Logic matters…
The first take we can use is purely conceptual, based on logic. That is to say – we don’t even necessarily need to get too “mathematical” about it…
Myth: it’s better that a team considers the expected complications and take that into consideration and thus adding an assumption on top of the item to be planned (i.e., making it a bigger story pointing wise). Put it simply – story point is nothing else than throughput plus a (complexity) factor.
Reality: no dispute that good teams can to some extend take complexity upfront into perspective, and perhaps that is even an interesting conversation to have (who’s making what kind of assumptions). It doesn’t change the fact that throughput (count of items that got done in a period) is what actually have happened, and thus already have embedded any kind of complexities that might have incurred.
To put it in simpler terms…
Throughput is reality (as opposed to an expectation). Throughput also already patterns embed complexity to deliver (as opposed to making assumptions about it). And thus, arguably better cater for thinking probabilistically, especially if coupled with use of simulations to do the forecasting.
“In God we trust. All others must bring data” (W. Edwards Deming)
Maybe this is you right now – “fair enough, Rodrigo. But you’re not God, so you must bring data!”. My turn – “fair enough… hold my beer (more often glass of wine, though)…”
I like giving credit where it’s due, I came across this LinkedIn post, which helped me to remember a simple golden rule of mathematics (see below), as well as provided a simple test to check whether we should use story points or simply throughput as a means to forecast.
Here’s how it works:
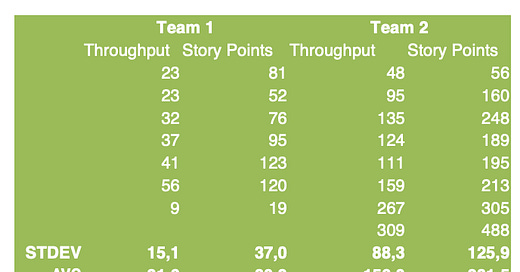
Take the last series of a period (sprint, if you use it, or you can also use weekly, whatever time frame) – something like 7 - 8 data points should give enough variability, but if you have more history, probably better (assuming context is sufficiently stable across the time of the data series)
List the number of story points as well as the simple count of items finished per period.
Calculate the Standard Deviation (STDEV) as well as the Average.
Divide the Standard Deviation by the Average to get the Coefficient of Variation (CoV).
Now compare the two: the lower the CoV, the more reliable (stable) that data is to be used for forecasting.
Empirical data indicates that rarely it happens that story points will have a significantly the lower variation (I personally have not seen yet, and the same for others I know about). Most of the times throughput “wins” (has lower CoV). Sometimes there’s basically a “draw" (roughly the same) – meaning you could go both ways, but that’s precisely when we should remind ourselves of one of the golden rules of mathematics. Never add complexity to models unnecessarily. (We can also called it KISS - "Keep It Simple, St…").
Whenever you can go both ways, basically what it tells us is that probably either too-good at estimation (not very likely) or have a well-stablished practice to slice work to be small and flow more smoothly (more likely). I can tell you the below examples from my experience that was precisely what was going on: with an average of 2.5 story points per item for Team 1, and 1.5 for Team 2.
Next time you happen to be having a conversation around estimation where someone feels so passionate about it, and how to use that to forecast plans, maybe this can come handy. In which case, allow me to say it upfront: “you’re most welcome!".
By Rodrigo Sperb, feel free to connect, I'm happy to engage and interact. If I can be of further utility to you or your organization in getting better at working with product development, I am available for part-time advisory, consulting or contract-based engagements.


